The Exploration Canvas #
The Exploration Canvas is the primary workspace in SemSpect. It visualizes the graph topology, allowing users to manipulate layout, throttle data density, and locate specific resources within the visible network.
Toolbar Controls #
The top toolbar controls graph layout and navigation.
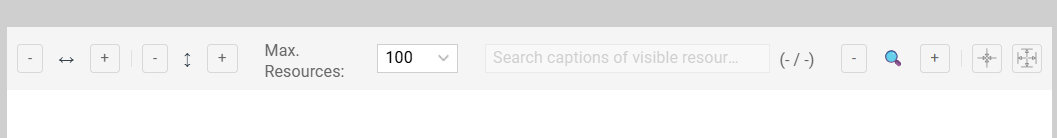
Layout & Navigation #
- Zooming: Use (+) / (-) buttons or the mouse wheel to adjust magnification.
- Clearance: Adjusts the spacing between groups to reduce overlap.
- Horizontal Clearance: Increases left-right distance.
- Vertical Clearance: Increases top-down distance.
- Fit to View: Click the Target Icon to center and zoom the graph so all nodes fit within the viewport.
History (Undo/Redo) #
SemSpect maintains a session history stack.
- Undo: Reverts the last action (e.g., removing a filter).
- Redo: Reapplies the undone action.
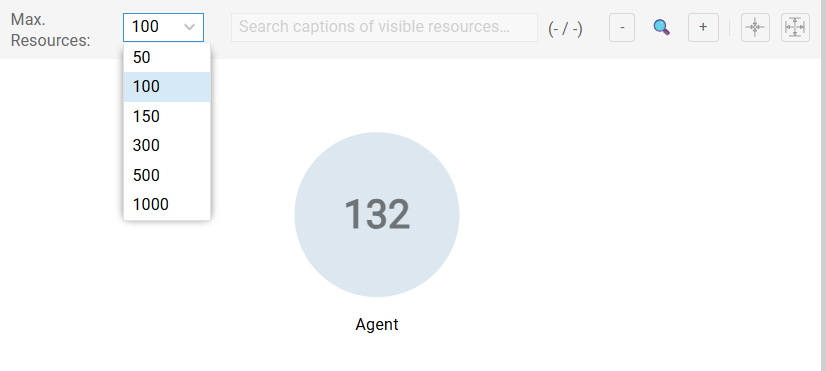
Managing Density (Max. resources) #
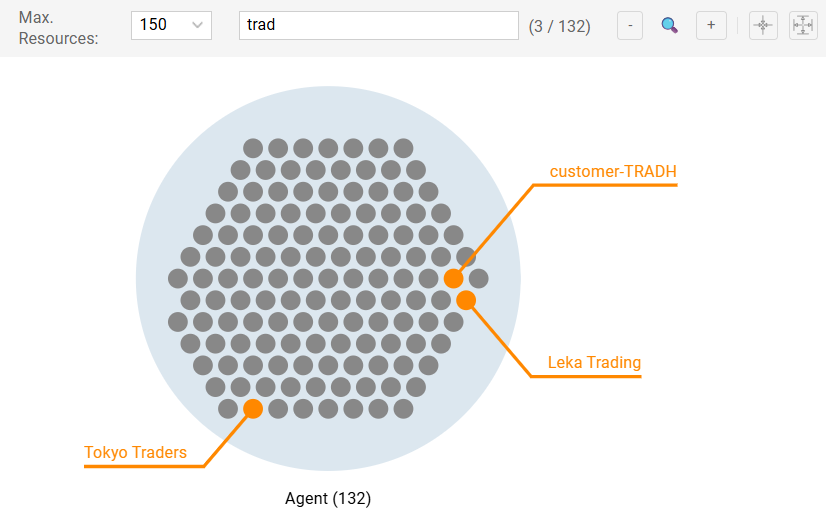
To manage browser performance and visual density, SemSpect aggregates resources into groups based on a user-defined threshold. Use the Max. resources dropdown to set this limit.
Aggregate View (Count > Threshold) #
If a group contains more resources than the limit, it renders as a single circle displaying the total count. This mode is optimal for high-level topology analysis.
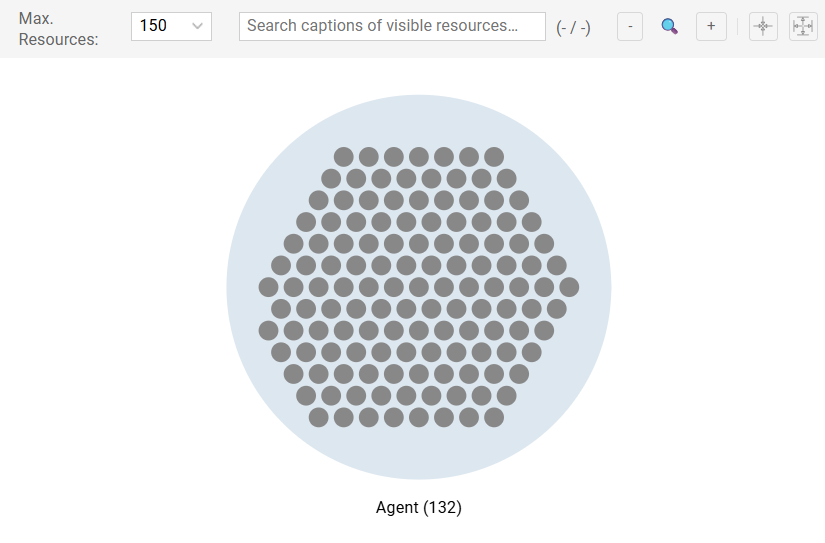
Instance View (Count ≤ Threshold) #
If the count is below the limit, the group expands to render individual dots.
- Hubs: resources with higher predecessor counts appear larger and gravitate toward the center.
- Badge: The number inside each dot represents its exact predecessor count (incoming connections).
Global Search (Visible resources) #
Locate specific resources within the currently visible graph.
- Scope: Searches only expanded resources on the canvas. It does not query the backend for hidden data.
- Behavior: Matches are highlighted with an orange flag and caption.
Exporting Visuals #
Export the current canvas state for reporting.
- Access: Right-click the canvas background or use the Exploration menu.
- Formats:
- Raster (PNG): For slides and quick sharing.
- Vector (SVG): For high-resolution print or editing.
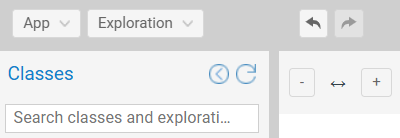
Database Summary #
When no group or connection is selected, the right-hand Details sidebar displays the Database Summary.
- Trigger: Click the empty canvas background to deselect items.
- Classes: Lists all available classes and their total cardinality.
- Object Properties: Lists all object properties and assertion counts.
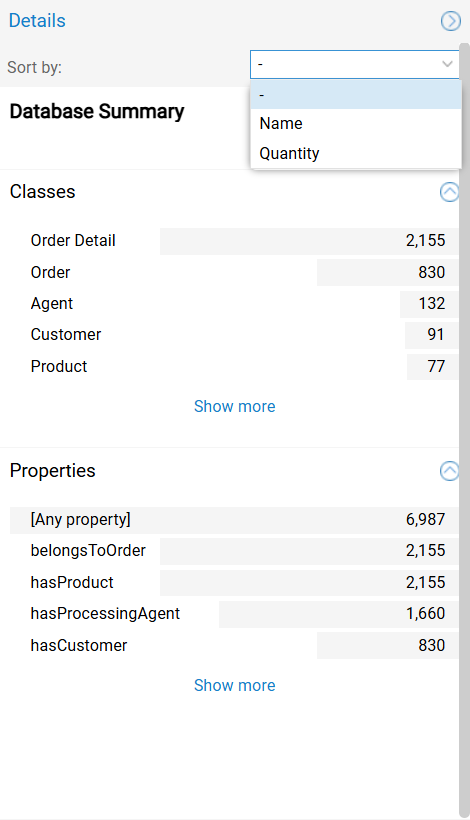
Sorting: Use the Sort by dropdown to order lists by Name (alphabetical) or Quantity (cardinality) to identify the largest entities.
Application & Data Controls #
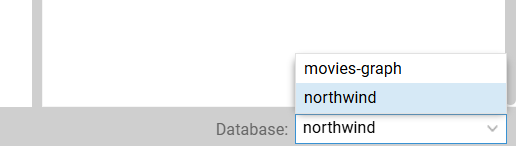
Database Selection #
For environments with multiple datasets:
- Location: Bottom-right footer.
- Usage: Click to switch the active dataset or snapshot.
Application Settings #
Access global configuration via the top-left dropdown menu.
General Configuration #
- Technical Details: Toggles visibility of low-level metadata, including IRIs and SPARQL queries.
- Tree Visibility: Hides empty or deactivated classes in the sidebar.
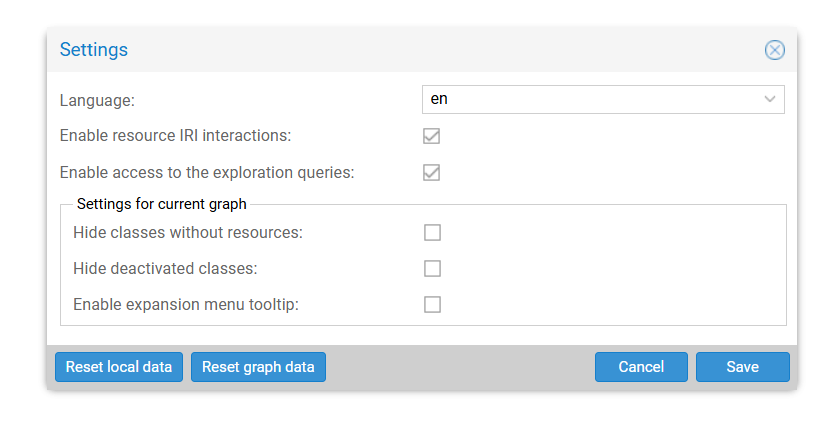
Troubleshooting & Resets #
- Reset local data: Clears browser-side preferences (column widths, sort orders).
- Reset graph data: Performs a “Factory Reset” of the analysis.
Destructive Action
Reset graph data permanently deletes all Custom Classes and Saved Explorations associated with the current database. This cannot be undone.
Error Logging #
Use Export error log (Main Menu) to generate a JSON diagnostic file for support requests.