Groups #
While the Canvas provides the visual topology, the Group serves as the gateway to the underlying records. This module details how to traverse the graph structure and inspect raw data using the Resource Table.
Expanding the Graph #
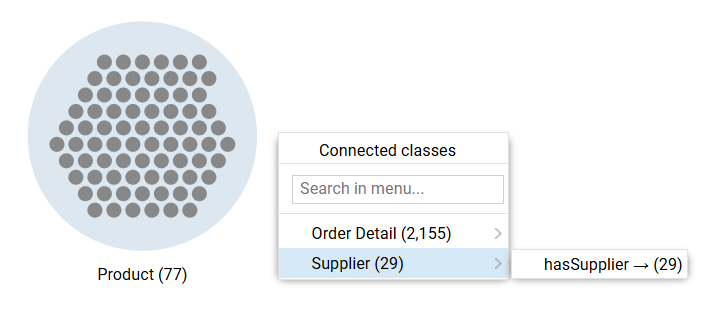
The Expansion Menu is the primary tool for traversing the graph. It discovers relationships connected to a specific group and adds them to the canvas.
The Expansion Menu #
- Trigger: Click any group to open the menu.
- Select: The menu lists connected object propertys, organized by target class.
- Action: Clicking an item adds a connection to a new group to the canvas.
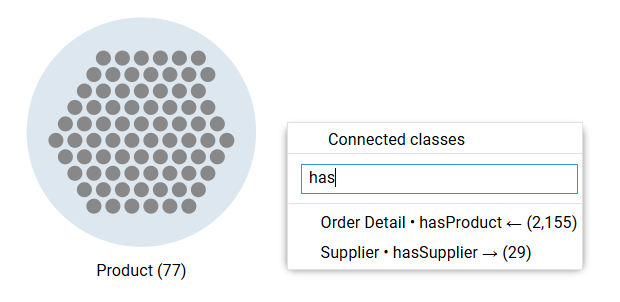
Search & Flattening #
For schemas with deep property hierarchies, use the search bar to locate specific paths.
- Flattening: Typing in the search bar removes the nested hierarchy and presents a flat list of all matching
class · object propertypairs. - Selection: Select the specific path to traverse.
Property Hierarchies
If the data model includes sub-properties, hover over the parent property in the menu to navigate the sub-menu and expand along a specific child property.
Group Operations #
Right-click a group to access high-level operations for the entire cluster.
- Export group resources as CSV: Downloads a file containing all resources currently in the group.
- Copy SPARQL Query: Copies the code required to generate this specific group (useful for debugging).
- Edit note: Adds a text annotation (persisted in Saved Explorations).
- Show resource table: Opens the detailed data view (see below).
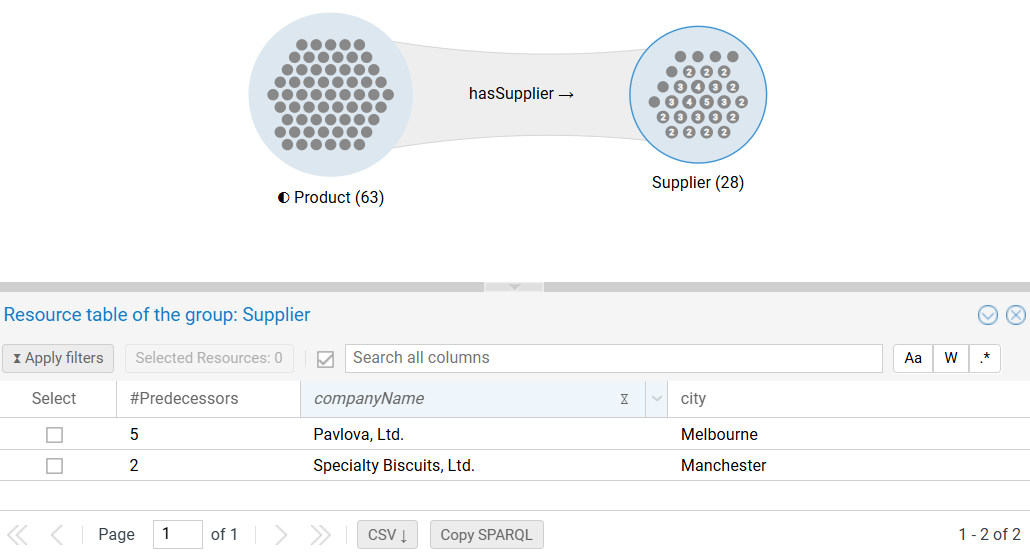
The Resource Table #
The Resource Table allows users to inspect, sort, and filter the raw attributes of the resources within a group.
Accessing the Table #
- Context Menu: Right-click the group and select Show resource table.
- Quick Action: Click the Blue Button (“Show resource table…”) that appears at the bottom of the canvas when a group is selected.

Table Anatomy #
The panel displays a spreadsheet view where rows represent resources and columns represent properties.

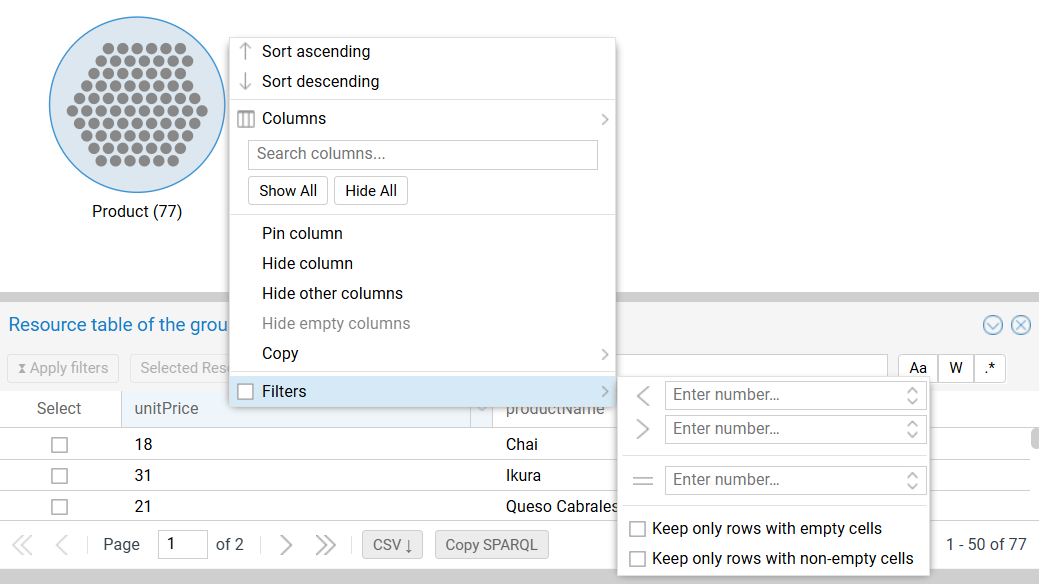
- Column Visibility: Click Columns to hide/show specific properties or reorder them via drag-and-drop.
- Sorting: Click a column header to toggle Ascending/Descending sort.
- Copying Data: Right-click any cell to copy its value.
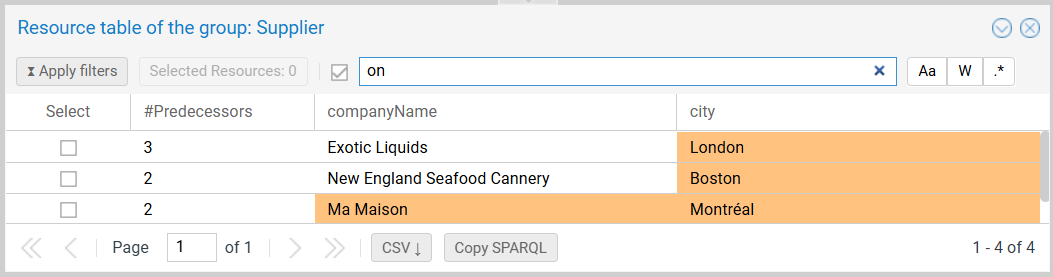
- Predecessors: The
#Predecessorscolumn displays the count of incoming links from the parent group. Sort this column to identify the most connected “Hub” resources.
Filtering Data #
The Resource Table is the engine for refining the graph. Apply filters here to narrow down the group population on the canvas.
The Filter Lifecycle #
Filtering is a two-step process to prevent unnecessary database queries.
- Define (Preview): Set criteria in the column headers. The table updates immediately to preview the result.
- Status: The column header displays an Hourglass (⧖) icon (pending).
- Execute (Apply): Click Apply filters (top-left).
- Status: The group updates, and a Filter Icon (◐) appears on the node (active).
Filter Types #
- Numeric/Date: Range controls (Greater than, Less than, Equals).
- String: Text matching (Contains, Starts with, Regex).
- Resource Selection: Check specific rows to restrict the group to those individual resources.
- Existence: Filter for Keep only rows with (non-)empty cells.
Multi-Column Search #
Use the global search bar to perform a string match across all visible columns. Matching cells are highlighted in orange.
Interaction & Exports #
The table is tightly coupled with the Resource Dossier.
Row Interaction #
- Highlighting: Clicking a row highlights the corresponding resource in the group (Red dot = Selected; Yellow dot = Hover).
- Dossier: Clicking a row also opens the Resource Dossier sidebar.
Table-Based Exports #
Unlike the bulk group export, table exports respect the current view (filters, sorting, columns):
- CSV Button: Downloads the filtered rows.
- Copy SPARQL: Copies the query used to generate the current table view.